Kubernetes - Setup Cert Manager for Automated TLS Management
Table of Contents
This post is part of our ongoing series on Kubernetes infrastructure management. In this installment, we’re focusing on setting up Cert Manager, a critical component for automating TLS certificate management. Although we’re working on a local Kubernetes cluster, we’ve implemented prerequisites in Kubernetes - Routing external traffic to local Kubernetes cluster to enable access to our internal cluster via public IP address, as well as configuring DNS automation with Kubernetes - Setup External DNS.
1. Setup Cert Manager
Let’s configure Cert Manager by creating cluster/default/cert-manager.yaml. This declarative configuration establishes:
- A dedicated Cert Manager namespace
- The Jetstack Helm Repository reference
- The Cert Manager Helm Release with appropriate configuration
 1---
 2apiVersion: v1
 3kind: Namespace
 4metadata:
 5  name: cert-manager
 6---
 7apiVersion: source.toolkit.fluxcd.io/v1
 8kind: HelmRepository
 9metadata:
10  name: jetstack
11  namespace: cert-manager
12spec:
13  interval: 10m
14  url: https://charts.jetstack.io
15---
16apiVersion: helm.toolkit.fluxcd.io/v2
17kind: HelmRelease
18metadata:
19  name: cert-manager
20  namespace: cert-manager
21spec:
22  releaseName: cert-manager
23  interval: 10m
24  chart:
25    spec:
26      chart: cert-manager
27      version: "1.16"
28      interval: 10m
29      sourceRef:
30        kind: HelmRepository
31        name: jetstack
32        namespace: cert-manager
33  values:
34    crds:
35      enabled: true
36    prometheus:
37      enabled: true
38      podmonitor:
39        enabled: true
Next, we’ll define a ClusterIssuer that integrates with Let’s Encrypt to provide our certificates. Create this in cluster/default/cluster-issuer.yaml
 1apiVersion: cert-manager.io/v1
 2kind: ClusterIssuer
 3metadata:
 4  name: cluster-issuer
 5  namespace: cert-manager
 6spec:
 7  acme:
 8    # The ACME server URL
 9    server: https://acme-v02.api.letsencrypt.org/directory
10    # Email address used for ACME registration
11    email: ****
12    # Name of a secret used to store the ACME account private key
13    privateKeySecretRef:
14      name: letsencrypt-default
15    solvers:
16    - http01:
17        ingress:
18          ingressClassName: traefik
After applying these configurations, let’s verify that the necessary secret keys have been generated and check for any potential errors:
1kubectl -n cert-manager get secrets
2
3NAME                                 TYPE                 DATA   AGE
4cert-manager-webhook-ca              Opaque               3      5m31s
5letsencrypt-default                  Opaque               1      3m39s
6sh.helm.release.v1.cert-manager.v1   helm.sh/release.v1   1      6m1s
We can confirm that the secret has been successfully generated. Now, let’s examine the logs for further diagnostics:
1kubectl -n cert-manager logs pods/cert-manager-84d588f4c6-gj6d4
2
3I0228 12:33:21.941719       1 setup.go:113] "generating acme account private key" logger="cert-manager.controller" resource_name="cluster-issuer" resource_namespace="" resource_kind="ClusterIssuer" resource_version="v1" related_resource_name="letsencrypt-default" related_resource_namespace="cert-manager" related_resource_kind="Secret"
4I0228 12:33:22.042104       1 setup.go:225] "ACME server URL host and ACME private key registration host differ. Re-checking ACME account registration" logger="cert-manager.controller" resource_name="cluster-issuer" resource_namespace="" resource_kind="ClusterIssuer" resource_version="v1" related_resource_name="letsencrypt-default" related_resource_namespace="cert-manager" related_resource_kind="Secret"
5I0228 12:33:23.515859       1 setup.go:315] "verified existing registration with ACME server" logger="cert-manager.controller" resource_name="cluster-issuer" resource_namespace="" resource_kind="ClusterIssuer" resource_version="v1" related_resource_name="letsencrypt-default" related_resource_namespace="cert-manager" related_resource_kind="Secret"
6I0228 12:33:23.516047       1 conditions.go:96] Setting lastTransitionTime for Issuer "cluster-issuer" condition "Ready" to 2025-02-28 12:33:23.515998646 +0000 UTC m=+120.676709968
7I0228 12:33:23.526676       1 setup.go:208] "skipping re-verifying ACME account as cached registration details look sufficient" logger="cert-manager.controller" resource_name="cluster-issuer" resource_namespace="" resource_kind="ClusterIssuer" resource_version="v1" related_resource_name="letsencrypt-default" related_resource_namespace="cert-manager" related_resource_kind="Secret"
8I0228 12:33:27.046621       1 setup.go:208] "skipping re-verifying ACME account as cached registration details look sufficient" logger="cert-manager.controller" resource_name="cluster-issuer" resource_namespace="" resource_kind="ClusterIssuer" resource_version="v1" related_resource_name="letsencrypt-default" related_resource_namespace="cert-manager" related_resource_kind="Secret"
The logs indicate that our configuration is functioning correctly, with the ACME account successfully registered with Let’s Encrypt.
2. Validate Setup
To validate our Cert Manager implementation, let’s enhance our existing sample application from the Kubernetes - Setup External DNS guide by adding TLS configuration. We’ll modify apps/sample-app/ingress.yaml:
 1apiVersion: networking.k8s.io/v1
 2kind: Ingress
 3metadata:
 4  name: sample-app-ingress
 5  namespace: default
 6  annotations:
 7    cert-manager.io/cluster-issuer: "cluster-issuer"
 8    external-dns.alpha.kubernetes.io/target: "******"
 9spec:
10  tls:
11  - hosts:
12    - sample-app.**
13    secretName: sample-app-tls
14  rules:
15    - host: sample-app.***
16      http:
17        paths:
18          - pathType: Prefix
19            backend:
20              service:
21                name: sample-app-service
22                port:
23                  number: 80
24            path: /
After committing these changes, let’s verify that HTTPS access to our application is working correctly:
1curl https://sample-app.***
2
3Greetings From K8S App : Version 2
Now, let’s perform a deeper inspection of the certificate to ensure it’s properly issued and configured:
 1openssl s_client -showcerts -connect sample-app.***:443
 2
 3Connecting to 15.235.210.126
 4CONNECTED(00000003)
 5depth=2 C=US, O=Internet Security Research Group, CN=ISRG Root X1
 6verify return:1
 7depth=1 C=US, O=Let's Encrypt, CN=R11
 8verify return:1
 9depth=0 CN=sample-app.***.email
10verify return:1
11---
12Certificate chain
13 0 s:CN=sample-app.***.email
14   i:C=US, O=Let's Encrypt, CN=R11
15   a:PKEY: rsaEncryption, 2048 (bit); sigalg: RSA-SHA256
16   v:NotBefore: Feb 28 11:44:22 2025 GMT; NotAfter: May 29 11:44:21 2025 GMT
The output confirms that SSL/TLS requests are working correctly, with a valid certificate issued by Let’s Encrypt that will remain valid for approximately 90 days.
3. Monitoring in Grafana
In our previous post Kubernetes GitOps with FluxCD - Part 4 - Helm Chart Automation - Kube Prometheus Stack we deployed the Kube Prometheus Stack which can automatically collect metrics from Cert Manager since we configured our Helm release with podmonitor enabled. Let’s now establish comprehensive certificate monitoring by integrating a specialized Grafana dashboard from the Cert Manager Mixin project.
We’ll begin by downloading the pre-configured dashboard JSON:
1curl --output cert-manager.json https://gitlab.com/uneeq-oss/cert-manager-mixin/-/raw/master/dashboards/cert-manager.json?ref_type=heads
Next, we’ll create a ConfigMap with the grafana_dashboard: 1 label, which will trigger automatic dashboard integration. Create dashboards/kustomization.yaml:
 1apiVersion: kustomize.config.k8s.io/v1beta1
 2kind: Kustomization
 3namespace: monitoring
 4configMapGenerator:
 5  - name: monitoring-grafana-dashboards
 6    files:
 7      - cert-manager.json
 8    options:
 9      labels:
10        grafana_dashboard: "1"
Finally, we’ll define a Flux Kustomization to manage this dashboard resource by creating cluster/default/dashboards.yaml
 1apiVersion: kustomize.toolkit.fluxcd.io/v1
 2kind: Kustomization
 3metadata:
 4  name: dashboards
 5  namespace: monitoring
 6spec:
 7  interval: 5m
 8  path: ./dashboards
 9  prune: true
10  retryInterval: 2m
11  sourceRef:
12    kind: GitRepository
13    name: flux-system
14    namespace: flux-system
15  targetNamespace: monitoring
16  timeout: 3m
17  wait: true
After committing these changes, let’s verify that the ConfigMap has been generated successfully:
1kubectl -n monitoring get configmaps
2
3NAME                                                      DATA   AGE
4monitoring-grafana-dashboards-9dbtc2728b                  1      37s
To access and validate the Grafana dashboard, we’ll establish a port-forward to the Grafana service:
1kubectl -n monitoring port-forward service/kube-prometheus-stack-grafana 3000:80
2
3Forwarding from 127.0.0.1:3000 -> 3000
4Forwarding from [::1]:3000 -> 3000
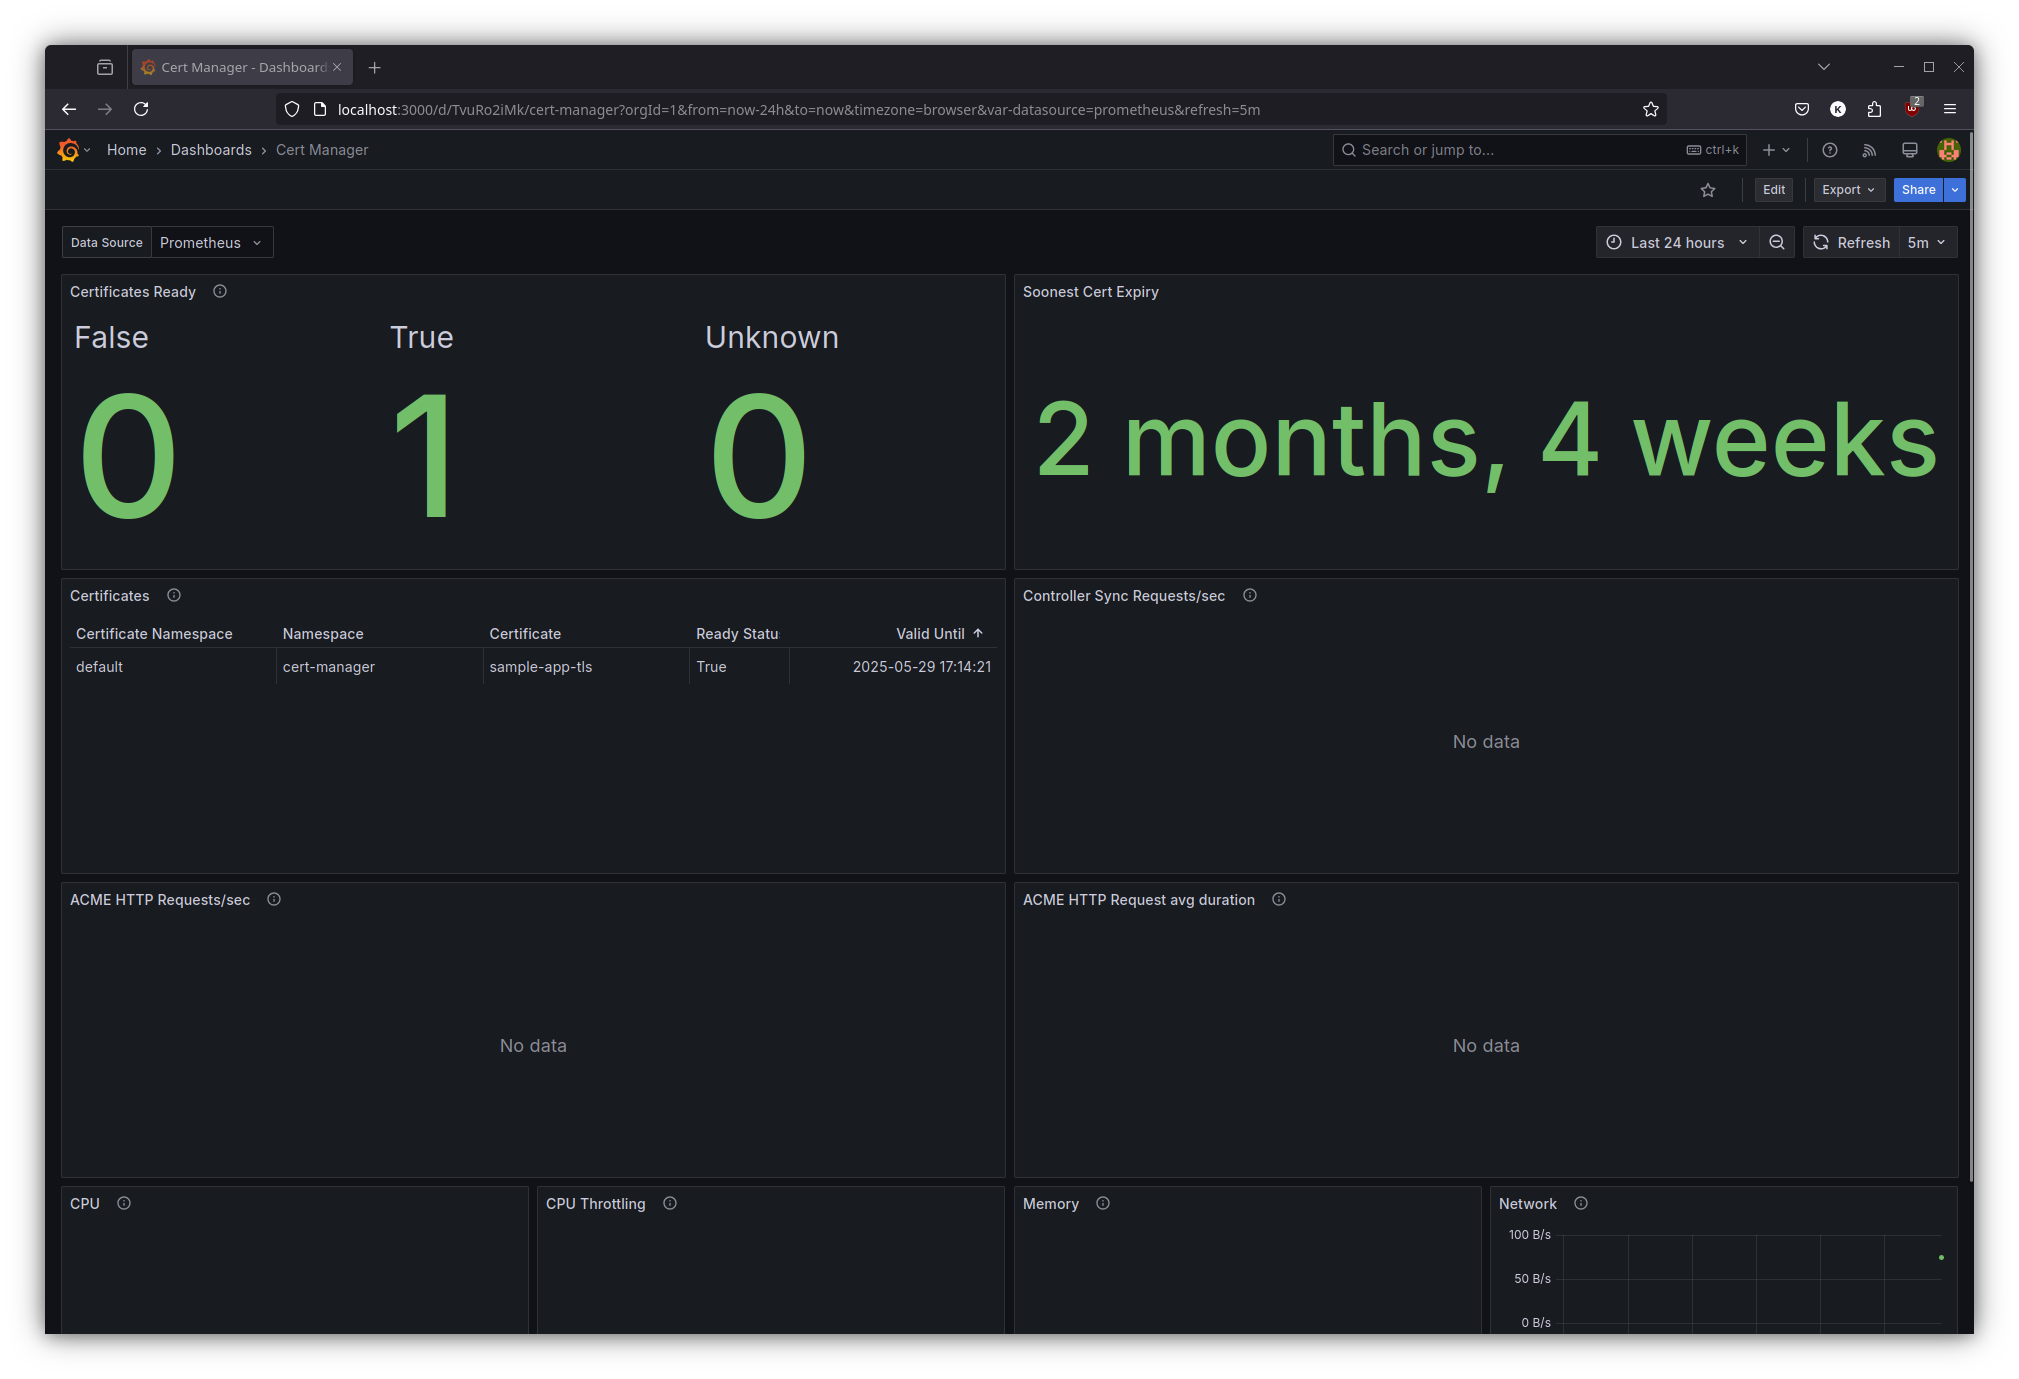
The dashboard allows us to comprehensively monitor certificate lifecycle events, including issuance, renewal schedules, and potential validation errors – enabling proactive certificate management.
What next ?
Future posts will explore advanced Kubernetes and GitOps patterns with FluxCD, including:
- Push based reconciliation triggers with Webhook receivers for FluxCD
Stay tuned for each of these topics.
References
- Kubernetes Documentation - https://kubernetes.io/docs/
- Cert Manager Documentation - https://cert-manager.io/
- Cert Manager Mixin - https://gitlab.com/uneeq-oss/cert-manager-mixin
- FluxCD Documentation - https://fluxcd.io/docs/